Transition Towards a Sustainable Strathclyde
Strathclyde Campus
The University of Strathclyde is in the heart of Glasgow city centre, and it is one of the oldest universities in Scotland dating back to 1796 when John Anderson, a professor in philosophy, opened the so-called Andersonian Institute. In 1964, the university received its royal charter as the first technological university and as a result, it was renamed to University of Strathclyde, taking the name from the historic Kingdom of Strathclyde (The Conversation, n.d.).
The John Anderson campus consists of a total of 27 buildings which are occupied by various faculties across the university such as engineering, sciences, humanities and social sciences, and the business school. The functionality of the buildings is the most important factor contributing to the heating consumption. The higher the consumption, the greater the amount of carbon emitted causing global warming and climate change. Hence the scope of this project was to examine the existing demand of the buildings and then suggest different strategies that would eventually enable the University of Strathclyde to lower its emissions and move towards a sustainable campus (Strathclyde, 2021).
Energy Demand
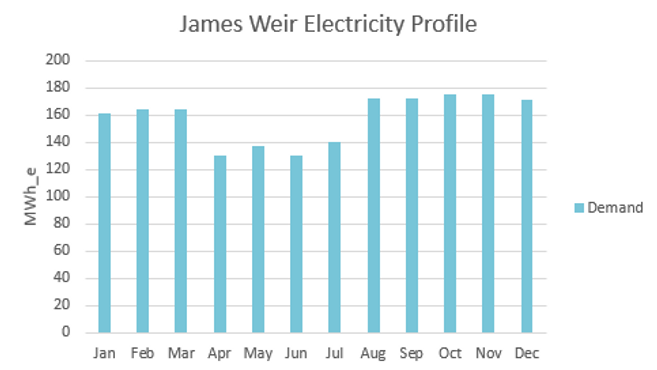
The electricity demand in 2021 amounted to 35 GWh which was distributed to lighting, ventilation, cooling, and appliances (WSP, 2021).15 GWh of this electricity demand was purchased from the national grid. Missing hydro, wind, and tidal potential, the university has installed some PV arrays to help in generating renewable energy for their own supply. Figure 1 shows the daily electricity demand profile of James Weir, one of the buildings which already features solar arrays.
Figure 1: Daily electricity consumption of James Weir
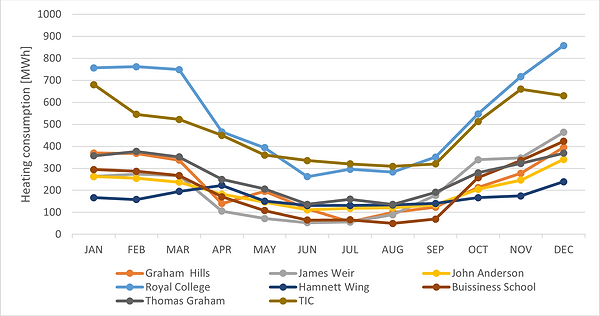
The heating demand in 2021 amounted to 43 GWh. The campus consists of older buildings dating back to 1910 such as the Royal College (RC) and newer, more energy efficient buildings such as the Technology and Innovation Centre (TIC) which started operation in 2015. Half-hourly metered data was used to evaluate the total heating demand of various buildings across the campus (see Figure 2). The graph shows exemplarily that age does not correlate with total consumption since RC and TIC are the two biggest heating consumers.
Figure 2: Total heating energy consumption of campus buildings in 2020
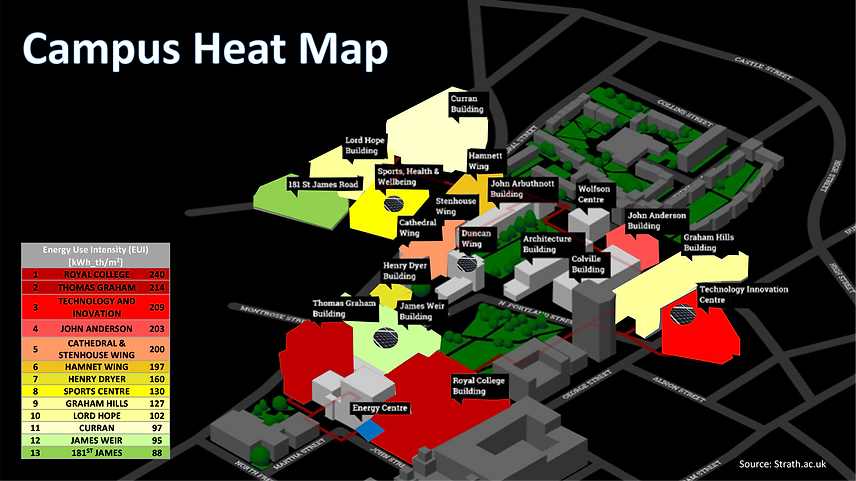
Royal College and Technology and Innovation Centre are at the same time, two of the largest buildings of the campus. Therefore, a more practical approach: Energy Use Intensity (EUI) was used to identify building performance. EUI describes the specific heating demand per gross internal area (GIA). This approach was used to generate a ‘campus heat map’ (see Figure 3). From the campus heat map, the Royal College has high energy intensity along with Thomas Graham, TIC, and John Anderson.
Figure 3: Campus heat map showing energy use intensity, existing PV arrays, and district heating pipes.
(For building in white and grey no data was available.)
Energy Supply
The energy supply of Strathclyde University (both heating and electrical power) relies on natural gas and electricity imports from the grid. Heating is provided by the district heating network (DHN) as well as some stand-alone boilers in buildings which are not connected to the network. The DHN was commissioned in 2018. In total, 18 buildings of the John Anderson Campus were connected to it – for more details see the heat map in the energy demand section. The DHN is fed by a combined heat and power scheme (CHP) situated in the university’s Energy Centre (EC). Complementary heat is provided by three boilers to cover peak loads and ensure demand is always covered. The CHP is currently running by following electricity demand with the heat generated being fed to the district heating network, whilst electricity is provided to the whole of the John Anderson Campus (see Figure 4).
Figure 4: Schematic of the district heating network feeding the John Anderson campus.
Since the majority of the buildings were connected to the DHN, the CHP hence replaced existing stand-alone boilers. Thus, natural gas is mainly used to power the CHP instead of boilers. According to the Environmental Protection Agency of US, the total efficiency of such systems can reach up to 80% (EPA, 2022). In contrast, traditional fossil fuelled power plants can have efficiencies of 32% to 36% (Statista, 2021). These values lead to the conclusion that almost 2/3 of the primary energy used is being wasted as heat to the ambient. A CHP makes use of this heat by supplying it to the DHN, thus reaching a higher efficiency. Furthermore, generating electricity in-house avoids electricity losses due to transmission and distribution. On that account, the CHP is considered an energy efficient way of generating electricity whilst making use of waste heat.
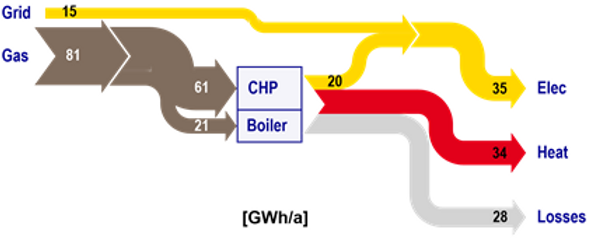
The DHN providing heat to the John Anderson campus works with constant supply and return temperatures of 90 °C and 65 °C respectively. Thus, it would be categorised as 3rd generation district heating system (3GDH) according to (Lund et al. 2014). Many research articles have been published recently on how to develop a 3GDH towards a 4th generation district heating system (4GDH). Lower supply temperature would result in smaller heating losses of pipes which will allow, for the integration of waste heat sources that up to now are untapped (Li and Nord 2018; Lund et al. 2018; Sorknæs et al. 2020; Østergaard et al. 2022). This seems true for the existing system of the John Anderson campus as well. WSP recently analysed the DHN and pinpointed high losses in conversion nearly reaching the amount of heat provided (see Figure 5) whilst network losses were described to be small (less than 4%).
Figure 5: Sankey diagram for the DHN, own visualisation based on (WSP, 2021)
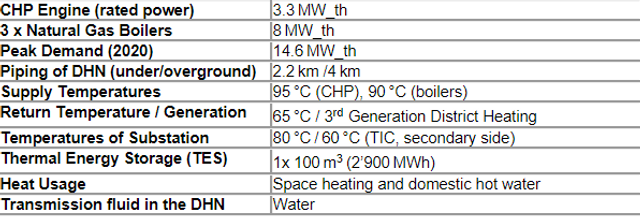
Some of the system’s specifications can be found summarised in table 1.
Table 1: The district heating network fed by combined heat and power, system specifications
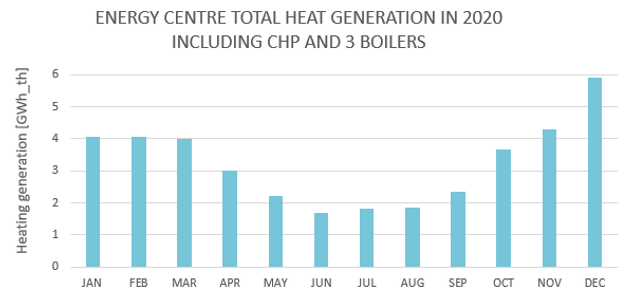
The monthly heating energy supply has been processed as shown in Figure 6.
Figure 6: Monthly heat generation supplied to the district heating network
Targets
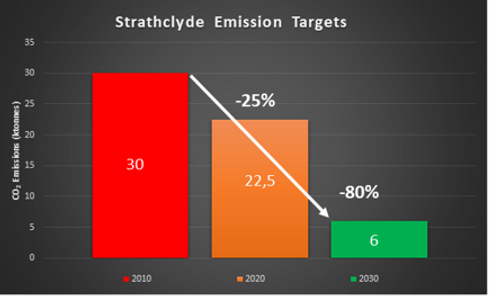
Strathclyde have published their emission targets in their yearly sustainability reports (Strathclyde, 2021). The emissions that they refer to come from two major areas: fossil fuel combustion and grid electricity consumption. Figure 7 shows the targets based on the sum of both areas’ emissions. In 2010 the university recorded carbon emissions of 30,000 tonnes CO2(e). This value would act as a baseline for the targets that the university set itself.
Figure 7: Strathclyde’s emission targets for 2020 and 2030 and baseline 2010
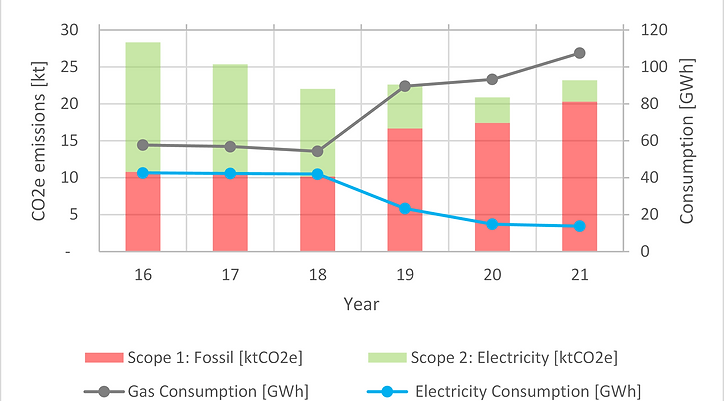
Strathclyde met its sustainability target of a 20% reduction every year since 2018, missing it by a small margin in 2021 (see Figure 8). Gas and electricity consumption stayed almost constant between 2016 and 2018. Since the commissioning of the CHP, the electricity taken from the grid steeply declined and gas consumption for electricity production raised sharply. Data availability at this stage does not allow for the projection to 2030.
Figure 8: Reported Electricity and gas consumption and associated carbon emissions 2016 to 2021
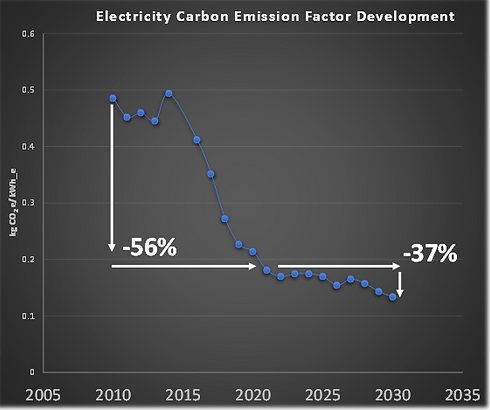
After analysing the campus energy system and reviewing the sustainability reports, it was anticipated that the decarbonisation of the UK electricity grid was a major contributor to the 25% reduction in emissions by 2020. Over the last 10 years, carbon emission factors for electricity have plummeted due to advancing renewable energy technologies and investment. In the years to come, these emission factors are expected to be inadequate in ensuring that an 80% reduction from the 2010 baseline emissions, could be met. Figure 9 shows the emission factor development between 2010 to 2022 as well as the forecasted emission factors up to 2030 (ICAX, n.d.; NationalGridESO, 2021).
Figure 9: Carbon emission factor development 2010 to 2020 and forecast until 2030
The university recognises the task ahead, referencing the contribution of emission factors in meeting their 2020 targets and acknowledging the scale of the task ahead if they are able to succeed in meeting the 2030 target (Strathclyde, 2021). Finding ways of helping the university meet their emission targets for 2030 and beyond was a key motivator for carrying out this project.
Effect of Covid
On the 24th of March 2020, Scotland officially began the first day of lockdown due to the COVID-19 pandemic to combat the spread of the virus. This included the shutting of the John Anderson campus meaning all work would be undertaken from the confines of an individual’s home, both for students and lecturers. This lockdown was undeniably a tough and damaging time as all of society had to adapt to severe restrictions. However, this situation has provided an opportunity to rethink how many businesses and organisations typically carry out their day-to-day operations. When looking at the university specifically, lectures, tutorials, and meetings all had to be carried out in an online capacity from home, something that before this dramatic event would not have been considered on such a large scale. This adaptation to online life clearly changed the use of campus buildings, most of which then lay derelict, in theory saving massively in terms of the demand of heating and powering buildings that previously housed hundreds of people. This begs the question can lessons be learned that lead to a new system where energy demand can be substantially reduced while still providing a high-quality learning experience for students and work life for staff.
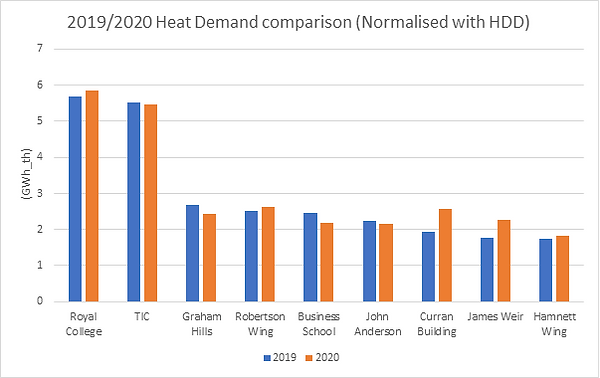
The data made available was analysed with a view to determining how the pandemic affected the heating demand of the campus. This data came in the form of half-hourly heat meter readings across some of the most energy intensive buildings on the John Anderson campus. The years 2019 and 2020 would give a good indication of the energy consumption of the campus before, during and after the pandemic, see Figure 10 normalised with heating degree days, HDD (Stark 2021).
Figure 10: Heat Demand Comparison 2019/2020
From Figure 10, in 2020, when the campus was essentially empty, there was an increase in heat provided to the university. This may be explained by missing internal gains of people, lighting, and equipment. Furthermore, this suggests that very few to no control changes were made about heating setpoints on the campus because of the COVID-19 pandemic, and thus, an almost derelict campus. It was assumed that this was possibly due to the uncertainty of the length of time and severity of the restrictions. The university may have been reluctant to completely shut down the heating system of the campus if it was originally assumed that the restrictions may be in place for only a few months. There may have also been logistical constraints in shutting down the heating system as it is unlikely to be a simple on/off process. However, with better control systems there is room for improvement in this system in the form of not providing energy to buildings that are not in use. For the university to meet their targets, a more efficient and smarter control system would be very helpful.
References
-
EPA (19.04.2021): CHP Benefits. Available at: https://www.epa.gov/chp/chp-benefits (accessed 07.05.2022)
-
ICAX (n.d.): Grid Carbon Factors. Available at https://icax.co.uk/Grid_Carbon_Factors.html (accessed 23.02.2022)
-
Li, Haoran; Nord, Natasa (2018): Transition to the 4th generation district heating - possibilities, bottlenecks, and challenges. In Energy Procedia 149, pp. 483–498. DOI: 10.1016/j.egypro.2018.08.213.
-
Lund, Henrik; Werner, Sven; Wiltshire, Robin; Svendsen, Svend; Thorsen, Jan Eric; Hvelplund, Frede; Mathiesen, Brian Vad (2014): 4th Generation District Heating (4GDH). In Energy 68, pp. 1–11. DOI: 10.1016/j.energy.2014.02.089.
-
Lund, Henrik; Duic, Neven; Østergaard, Poul Alberg; Mathiesen, Brian Vad (2018): Future district heating systems and technologies: On the role of smart energy systems and 4th generation district heating. In Energy 165, pp. 614–619. DOI: 10.1016/j.energy.2018.09.115.
-
NationalGridESO (2021): Electricity Ten Year Statement. Available at: https://www.nationalgrideso.com/research-publications/etys (accessed 21.04.2022)
-
Østergaard, Dorte Skaarup; Smith, Kevin Michael; Tunzi, Michele; Svendsen, Svend (2022): Low-temperature operation of heating systems to enable 4th generation district heating: A review. In Energy 248, p. 123529. DOI: 10.1016/j.energy.2022.123529.
-
Sorknæs, Peter; Østergaard, Poul Alberg; Thellufsen, Jakob Zinck; Lund, Henrik; Nielsen, Steffen; Djørup, Søren; Sperling, Karl (2020): The benefits of 4th generation district heating in a 100% renewable energy system. In Energy 213, p. 119030. DOI: 10.1016/j.energy.2020.119030.
-
Stark (2021): Degree Days For Free. Available online at https://www.stark.co.uk/degree-days-for-free/ (accessed 15.02.2022)
-
Statista (July 2021): Thermal efficiency of coal fired stations in the United Kingdom (UK) from 2010 to 2020. Available at: https://www.statista.com/statistics/548964/thermal-efficiency-coal-fired-stations-uk/ (accessed 04.05.2022)
-
Strathclyde (09.06.2021): Annual Climate Change and Social Responsibility Performance Report – An update on headline climate change performance for the financial year 2019/2020. Available at: https://www.strath.ac.uk/whystrathclyde/campusupdate/sustainabilityreport2019-2020/ (accessed 03.02.2021)
-
The Conversation (not dated): University of Strathclyde. Available at https://theconversation.com/institutions/university-of-strathclyde-1287 (accessed 11.05.2022)
-
WSP, 03.12.2021. UoS Sankey Diagrams – Technical Note. Confidential Report.